Market Trends
The real estate market continues to show dynamic shifts as we move through 2025, with notable trends shaping both buyer and seller behaviors. From fluctuating listing prices to changes in inventory and absorption rates, these metrics highlight the balance—or imbalance—between supply and demand in today’s housing landscape. By analyzing month-to-month and year-over-year data, we gain valuable insight into where the market stands and where it may be heading.

The chart above provides an overview of real estate activity from January to July 2025, with comparisons to the previous month, the last three months, and July 2024. It highlights key indicators such as new listings, average sales price per square foot, days on market, inventory levels, and absorption rates. Notably, July 2025 shows a decline in new listings and median sales prices compared to June, while the number of properties for sale increased, suggesting a cooling market with more choices for buyers.

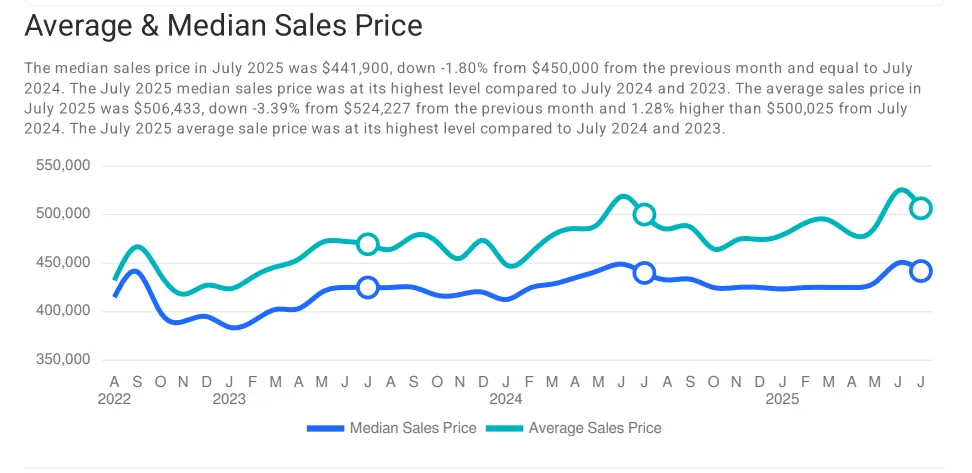
The chart shows the average and median sales prices for homes from 2022 through July 2025. In July 2025, the median sales price was $441,900, reflecting a 1.80% decline from the previous month ($450,000) but remaining steady compared to July 2024. Despite this dip, the median price was still at one of its highest levels compared to July 2023 and 2024.
The average sales price in July 2025 was $506,433, marking a 3.39% decline from June’s $524,227. However, it remained 1.28% higher year-over-year than July 2024’s $500,025. Overall, the chart indicates that while home prices are showing some short-term softening, both average and median prices are still near record highs, signaling that housing affordability remains a pressing issue for buyers.

The chart illustrates the Sales Price to List Price Ratio from 2022 through July 2025. This ratio measures how close final sales prices are to the original list prices. A value above 100% indicates homes selling above asking, while below 100% reflects discounts at closing.
In July 2025, the sales price/list price ratio stood at 98.57%, unchanged from June 2025 and equal to July 2024. This suggests that, on average, buyers are negotiating modest price reductions, and sellers are receiving slightly less than their asking price. While still relatively strong, the trend reflects a more balanced market compared to periods when homes consistently sold above asking.

The chart shows the number of properties sold and the absorption rate (the pace at which homes are sold relative to available inventory) from 2022 through July 2025.
In July 2025, 967 properties were sold, a 3.97% decline from June’s 1,007 sales but still 1.26% higher year-over-year compared to July 2024’s 955 sales. While monthly sales dipped slightly, they remain at some of the highest levels compared to the same period in 2023 and 2024, reflecting steady buyer demand.
The absorption rate in July 2025 held steady, indicating that although more homes are available, they are being purchased at a relatively consistent pace. This balance between inventory and sales suggests the market is neither strongly favoring buyers nor sellers, but trending toward stability.

The chart tracks the Average Days on Market (DOM) for homes between 2022 and July 2025. DOM measures how long it typically takes for a property to sell and is a key indicator of market speed and balance.
In July 2025, the average DOM was 40 days, showing a slight improvement (-2.44%) from June’s 41 days, but still 37.93% higher year-over-year compared to 29 days in July 2024. This means homes are taking longer to sell than in previous years, pointing to cooling demand and a shift toward a buyer’s market.
While homes are not lingering as long as during early 2023 peaks, the steady increase compared to last year highlights that buyers are moving more cautiously, and sellers may need to adjust pricing strategies or offer incentives to attract offers.

The chart tracks the Average Sales Price per Square Foot from 2022 through July 2025, providing a normalized measure of property value trends.
In July 2025, the average price per square foot was $190, unchanged from June but 1.55% lower than July 2024’s $193. While prices remain near historic highs, the slight year-over-year decline signals that property values may be stabilizing after rapid appreciation in recent years.
This measure is particularly useful because it accounts for variations in home size, offering a clearer picture of underlying market value. The flat month-to-month movement suggests that while buyer demand has cooled, sellers are still holding relatively firm on pricing, keeping values elevated.

The chart illustrates Active Inventory (number of properties for sale) and Months’ Supply of Inventory (MSI) from 2022 through July 2025.
In July 2025, there were 3,493 homes for sale, a 2.92% increase from June’s 3,394 and a substantial 40.39% jump year-over-year compared to 2,488 in July 2024. This marked the highest July inventory level in three years, signaling more options for buyers.
The MSI stood at 3.61 months, also the highest compared to July 2024 and 2023. A higher MSI favors buyers because it reflects more available inventory relative to sales. For sellers, this means increased competition and the potential need for more competitive pricing or incentives.

The chart tracks New Listings from 2022 through July 2025, showing how many homes entered the market each month.
In July 2025, there were 1,567 new listings, a 3.92% decline from June’s 1,631, but still 10.27% higher year-over-year compared to 1,421 in July 2024. This represents the highest July level in the past three years, signaling that more homeowners are willing to put their properties on the market despite shifting conditions.
While the slight month-to-month dip shows some seasonal cooling, the strong annual growth in new listings adds to the rising inventory trend, giving buyers more options and creating increased competition among sellers.